VolFIS
VolFIS is an innovative and freely accessible web server designed to empower users to craft exquisite and customizable graphical representations, such as volcano and survival plots. These high-resolution, publication-ready images are crafted with meticulous detail, offering users maximum customization while eliminating the need to delve into the intricacies of underlying code. Leveraging the power of R's ggplot and survminer packages, VolFIS simplifies the creation of visually striking graphics, making it a valuable tool for researchers, scientists, and data enthusiasts seeking to convey their data insights with precision and visual appeal.
Additionally, VolFIS offers a versatile toolset for genomics and bioinformatics enthusiasts. With this web server, users can seamlessly convert probe set IDs into various essential gene identifiers, including Gene Symbol, Entrez IDs, and more. This feature simplifies data integration and analysis, ensuring that researchers can easily navigate and make meaningful connections in the world of genomics. Whether you're a biologist, geneticist, or data scientist, VolFIS provides the interconvertibility for efficient and productive research.
ID Converter
The VolFIS web server offers a powerful ID converter tool, providing users with the ability to seamlessly convert probe set IDs for platforms like GPL570, GPL571, and GPL96 to a range of essential ID types, including Gene ID, Entrez ID, Ensembl ID, HGNC ID, and Refseq Accession.
Notably, these identifiers are all interconvertible, facilitating a smoother workflow and enhanced data accessibility for researchers.
Examples
Instructions
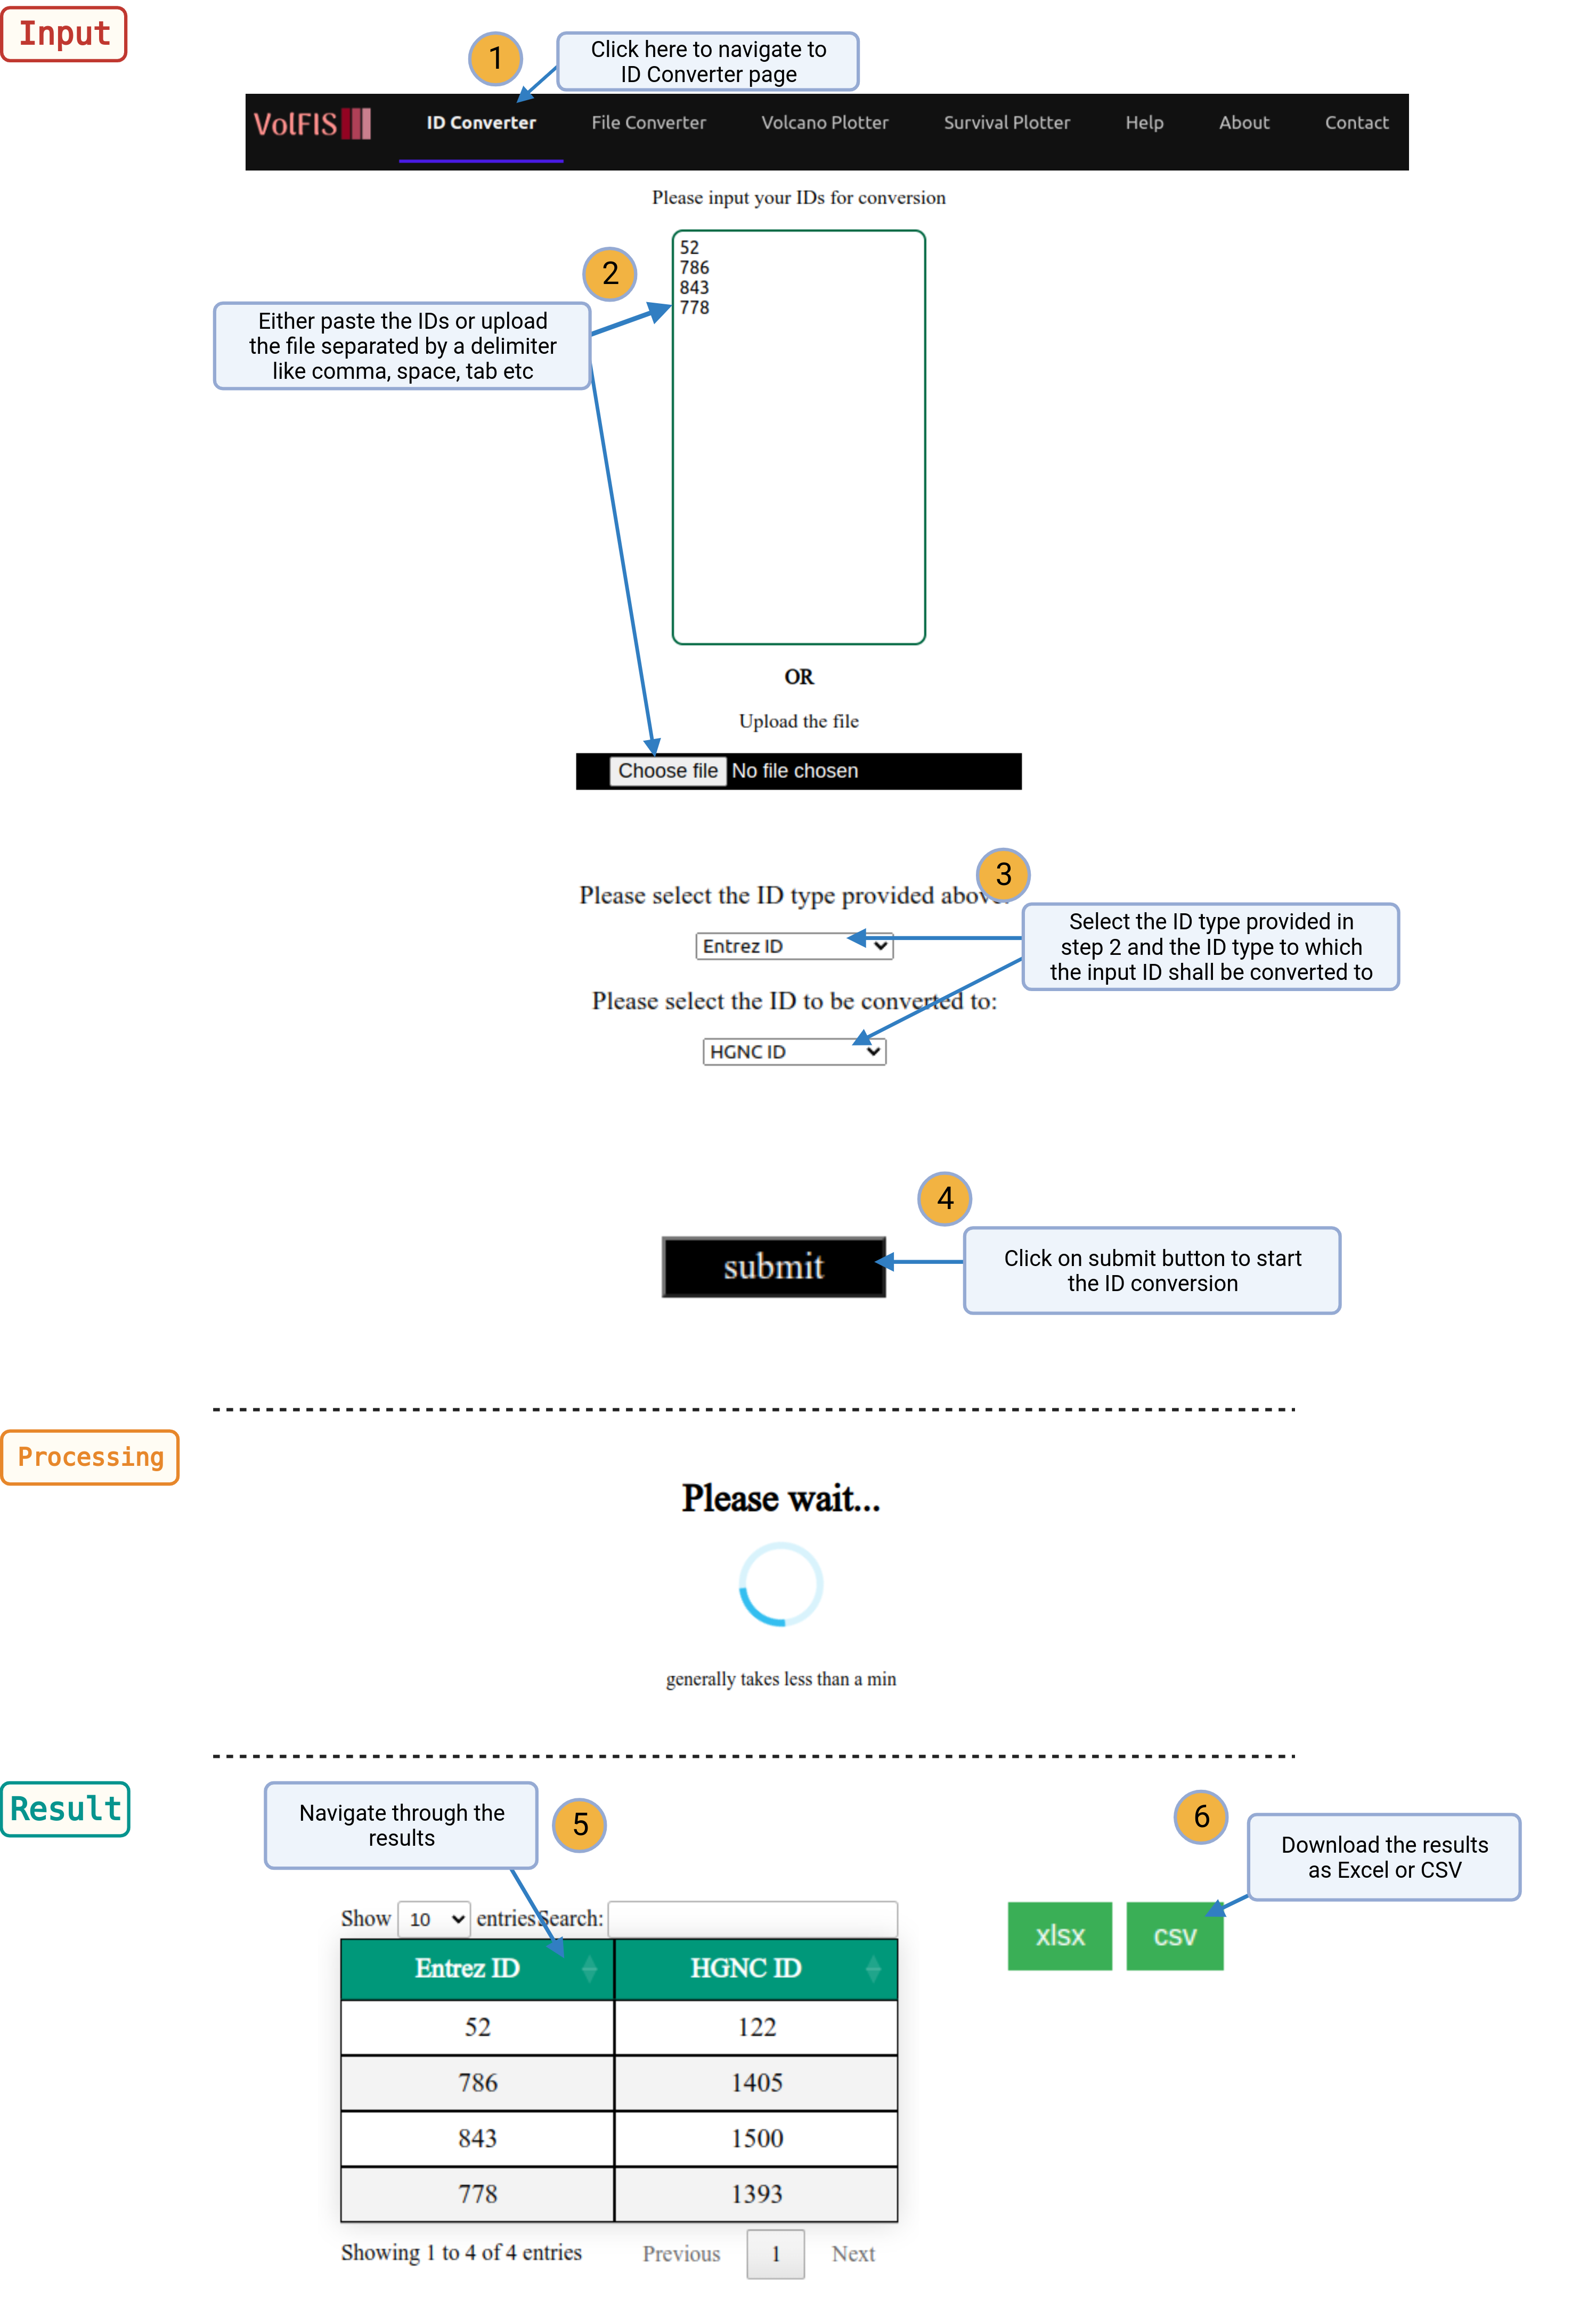
1. Navigate: Click on the ID Converter option provided in the navigation bar on top of the page.
2. Input IDs: To utilize the ID converter, users can either manually input their IDs into the provided text box or upload a file containing the IDs. The IDs can be separated by common delimiters like spaces, semi-colons, commas, tabs, and more.
3. Select ID Types: Next, select the given ID type and choose the desired target ID type to which they wish to convert their IDs to from the dropdown list.
4. Conversion: After selecting the appropriate ID types, users can initiate the conversion process by clicking the Submit button. The server will process the data, which typically takes just 2 to 5 seconds.
5. Results: Upon completion, a table will be displayed, showing the user-provided IDs alongside the corresponding IDs to which they have been converted. This clear and user-friendly presentation allows for easy data interpretation.
6. Download: Users have the option to download the entire table as a CSV or Excel file, enabling them to conveniently store, share, or further analyze the converted data. Download buttons are provided above the table for quick access.

Points to remember
- Allowed file types are :: TXT, TSV, CSV, XLS, XLSX
- List of delimiters :: New Line, Comma, Space, Exclamation, Semi-Colon, Tab
- Maximum length of characters allowed for an ID is 20
- Maximum number of IDs allowed for conversion per query is 1 Lakh (either pasted or uploaded via file)
File Converter
The VolFIS web server offers a robust File converter tool, designed to streamline the conversion of expression matrices containing probe sets for GPL570, GPL571, and GPL96 into a variety of essential ID types along with conversion support for Gene ID, Entrez ID, Ensembl ID, HGNC ID, and Refseq Accession. This versatile functionality supports the conversion to Gene ID, Entrez ID, Ensembl ID, HGNC ID, and Refseq Accession, with all identifiers being interconvertible.
Moreover, to address redundancy issues, VolFIS leverages the powerful R package WGCNA, employing the 'collapserows' function. Users can choose to merge duplicate or redundant IDs in the expression file based on criteria such as mean, variance, or eigenrow.
Examples
Instructions
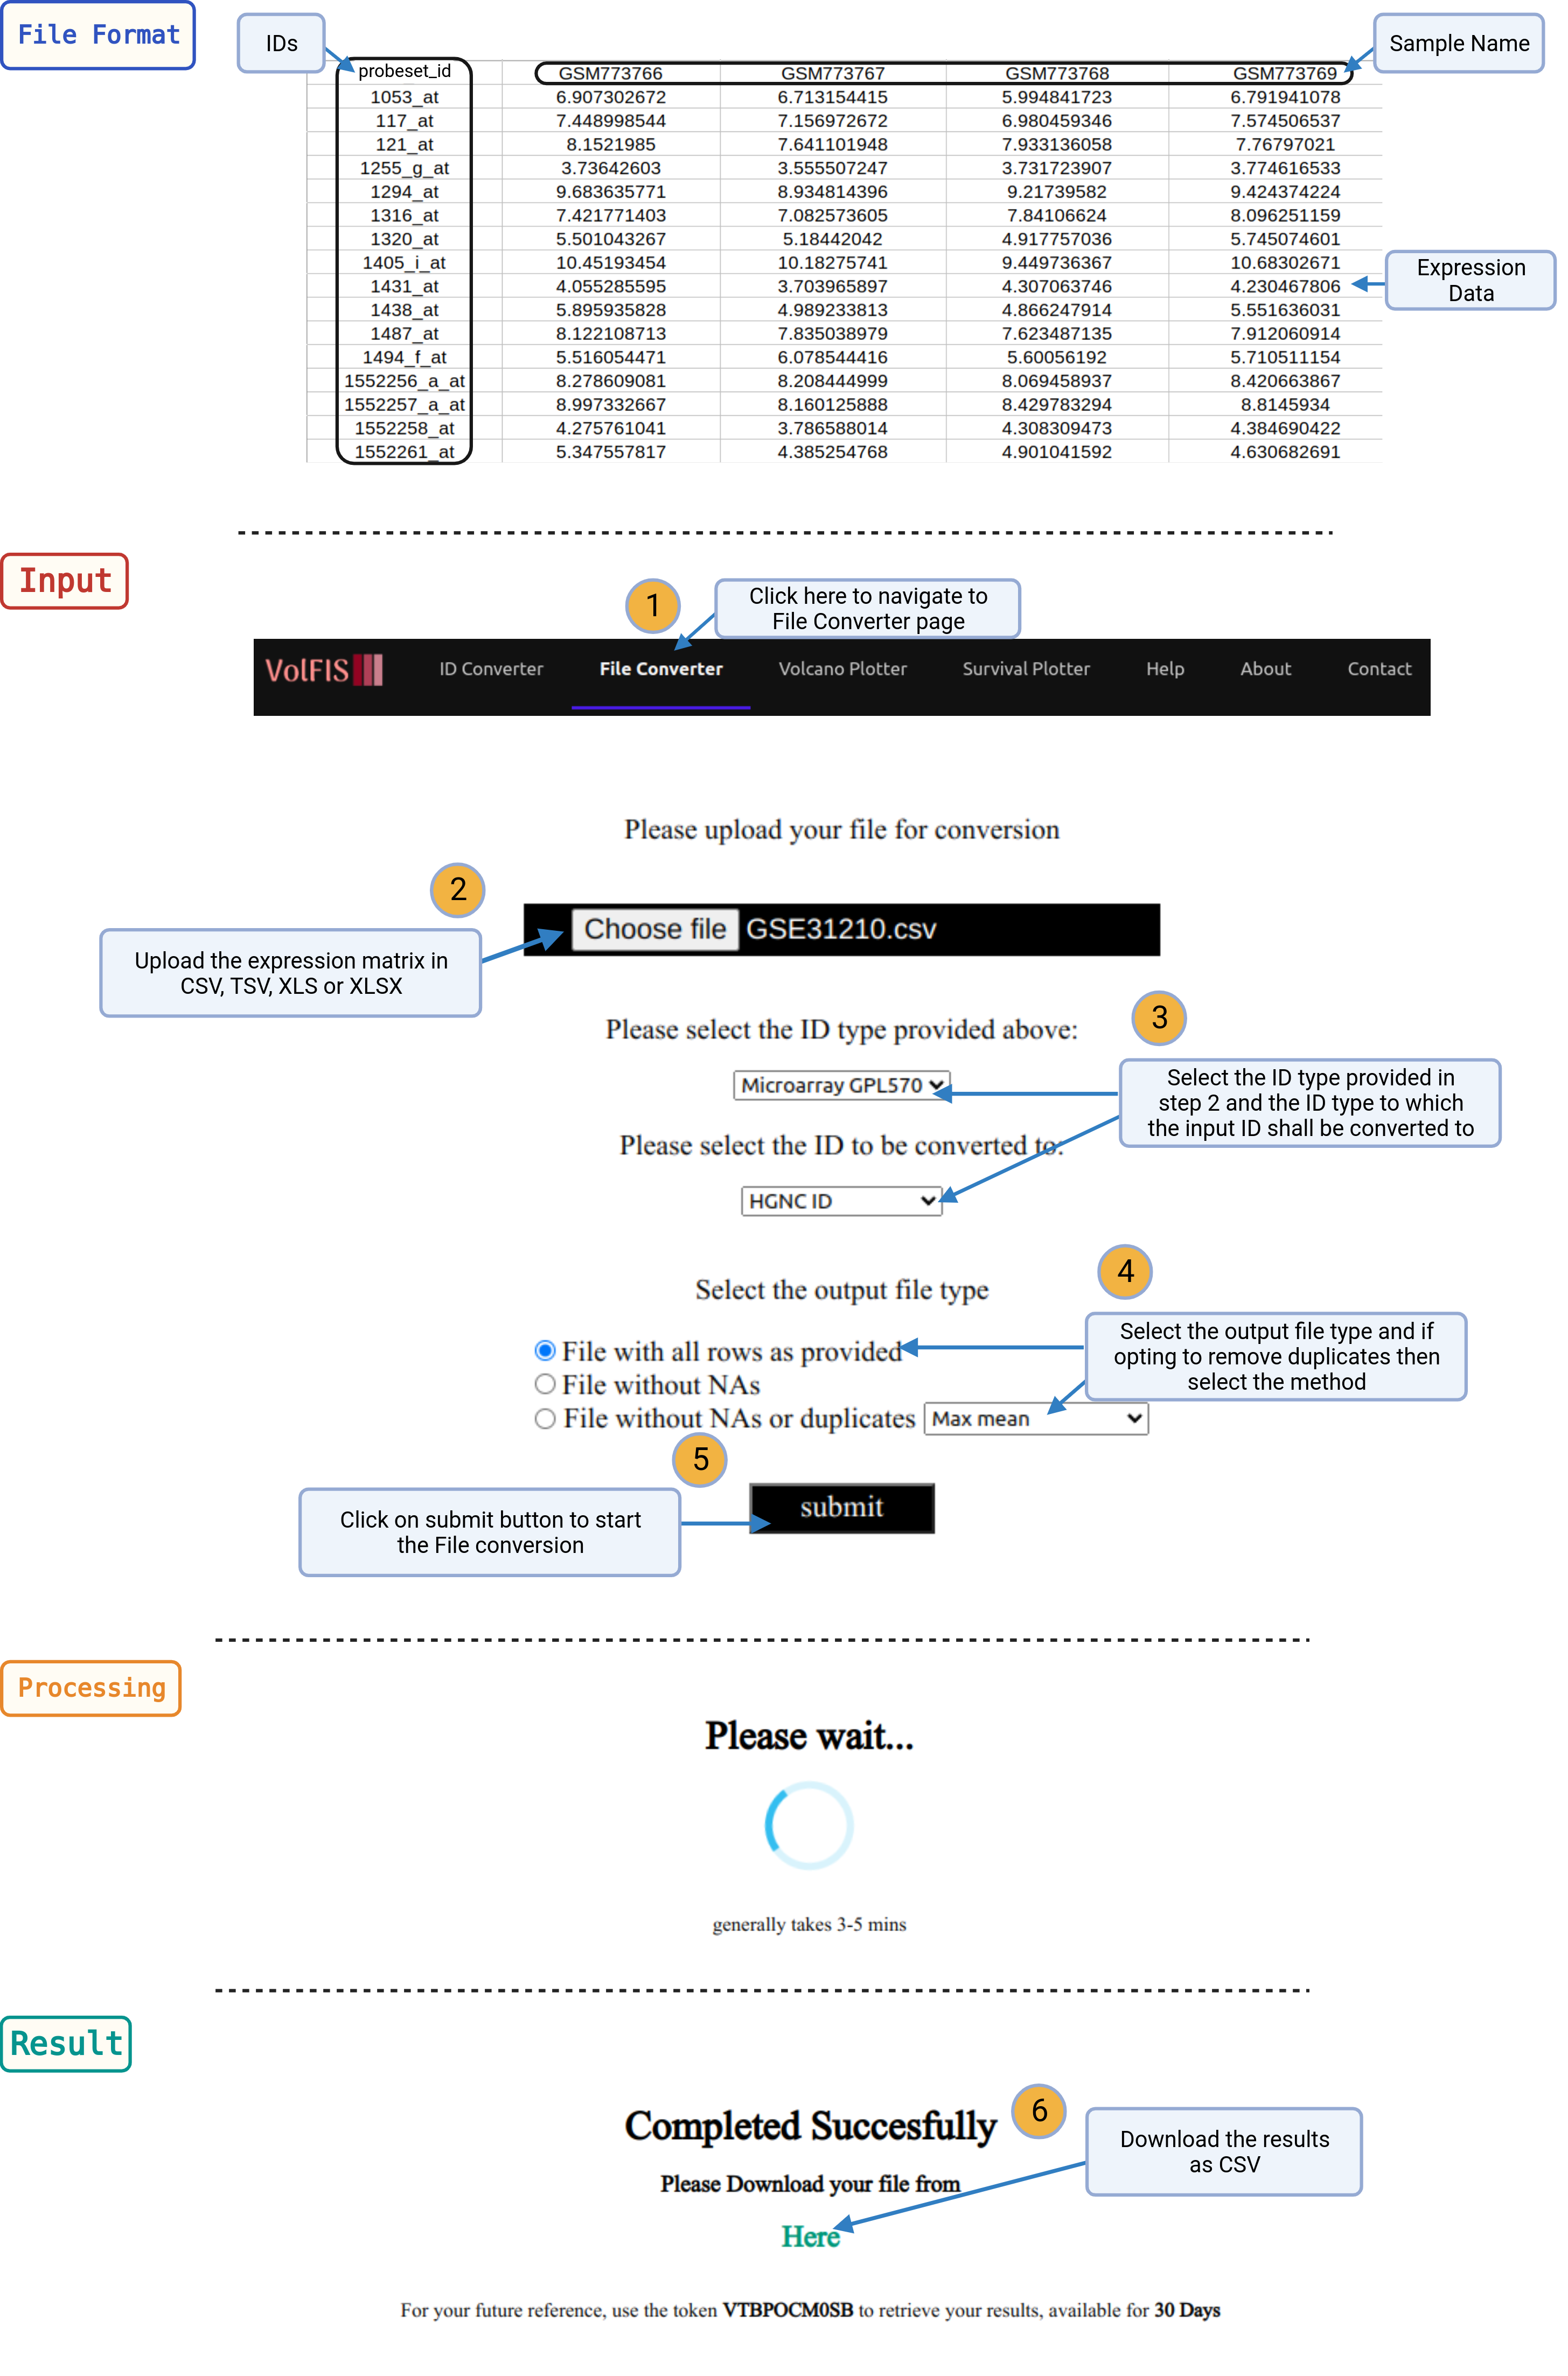
1. Navigate: Click on the File Converter option provided in the navigation bar on top of the page.
2. Upload Expression Matrix: To harness the capabilities of the File converter, users should begin by providing the expression matrix. The first row of the matrix should contain the IDs or probe sets relevant to the data.
3. Select ID Types: After uploading the expression matrix, users will need to select the initial ID type that corresponds to the IDs used in their data. Then, they must choose the target ID type to which they wish to convert the data from the dropdown list.
4. Merging Options (Optional): If the user would like to remove the non-converted and also the duplicate IDs then they can choose the third radio button and specify whether they want to merge the duplicate IDs based on mean, variance, or eigenrow.
5. Conversion: Once the ID types and merging options (if applicable) are selected, users can initiate the conversion process by clicking the Submit button. The server will process the data, and the duration may vary, taking between 10 seconds to 2 minutes, depending on the size of the matrix.
6. View and Download Results: Upon completion of the conversion process, the results will be displayed as a new matrix. This matrix will include the user-provided IDs in the first column and the corresponding converted IDs in the second column. To conveniently store, share, or further analyze the results, users can download the entire table as a CSV file using the provided link.

Points to remember
- Allowed file types are :: CSV, TSV, XLS, XLSX
- Maximum file size is 100 MB
- First Column should contain the IDs which are required to be converted
- First Row should contain the samples IDs
- Except first Column and first Row all the fields should be numeric
- Avoid using special characters like (. , - , ',') in Row names
Volcano Plotter
VolFIS introduces the Volcano Plotter, a powerful tool that enables users to effortlessly generate stunning, highly customizable, and publication-ready volcano plots.
With this feature, users can create visually compelling plots by simply providing an input file containing genes, fold change, and p-values, and then selecting their desired customization options.
Examples
Instructions
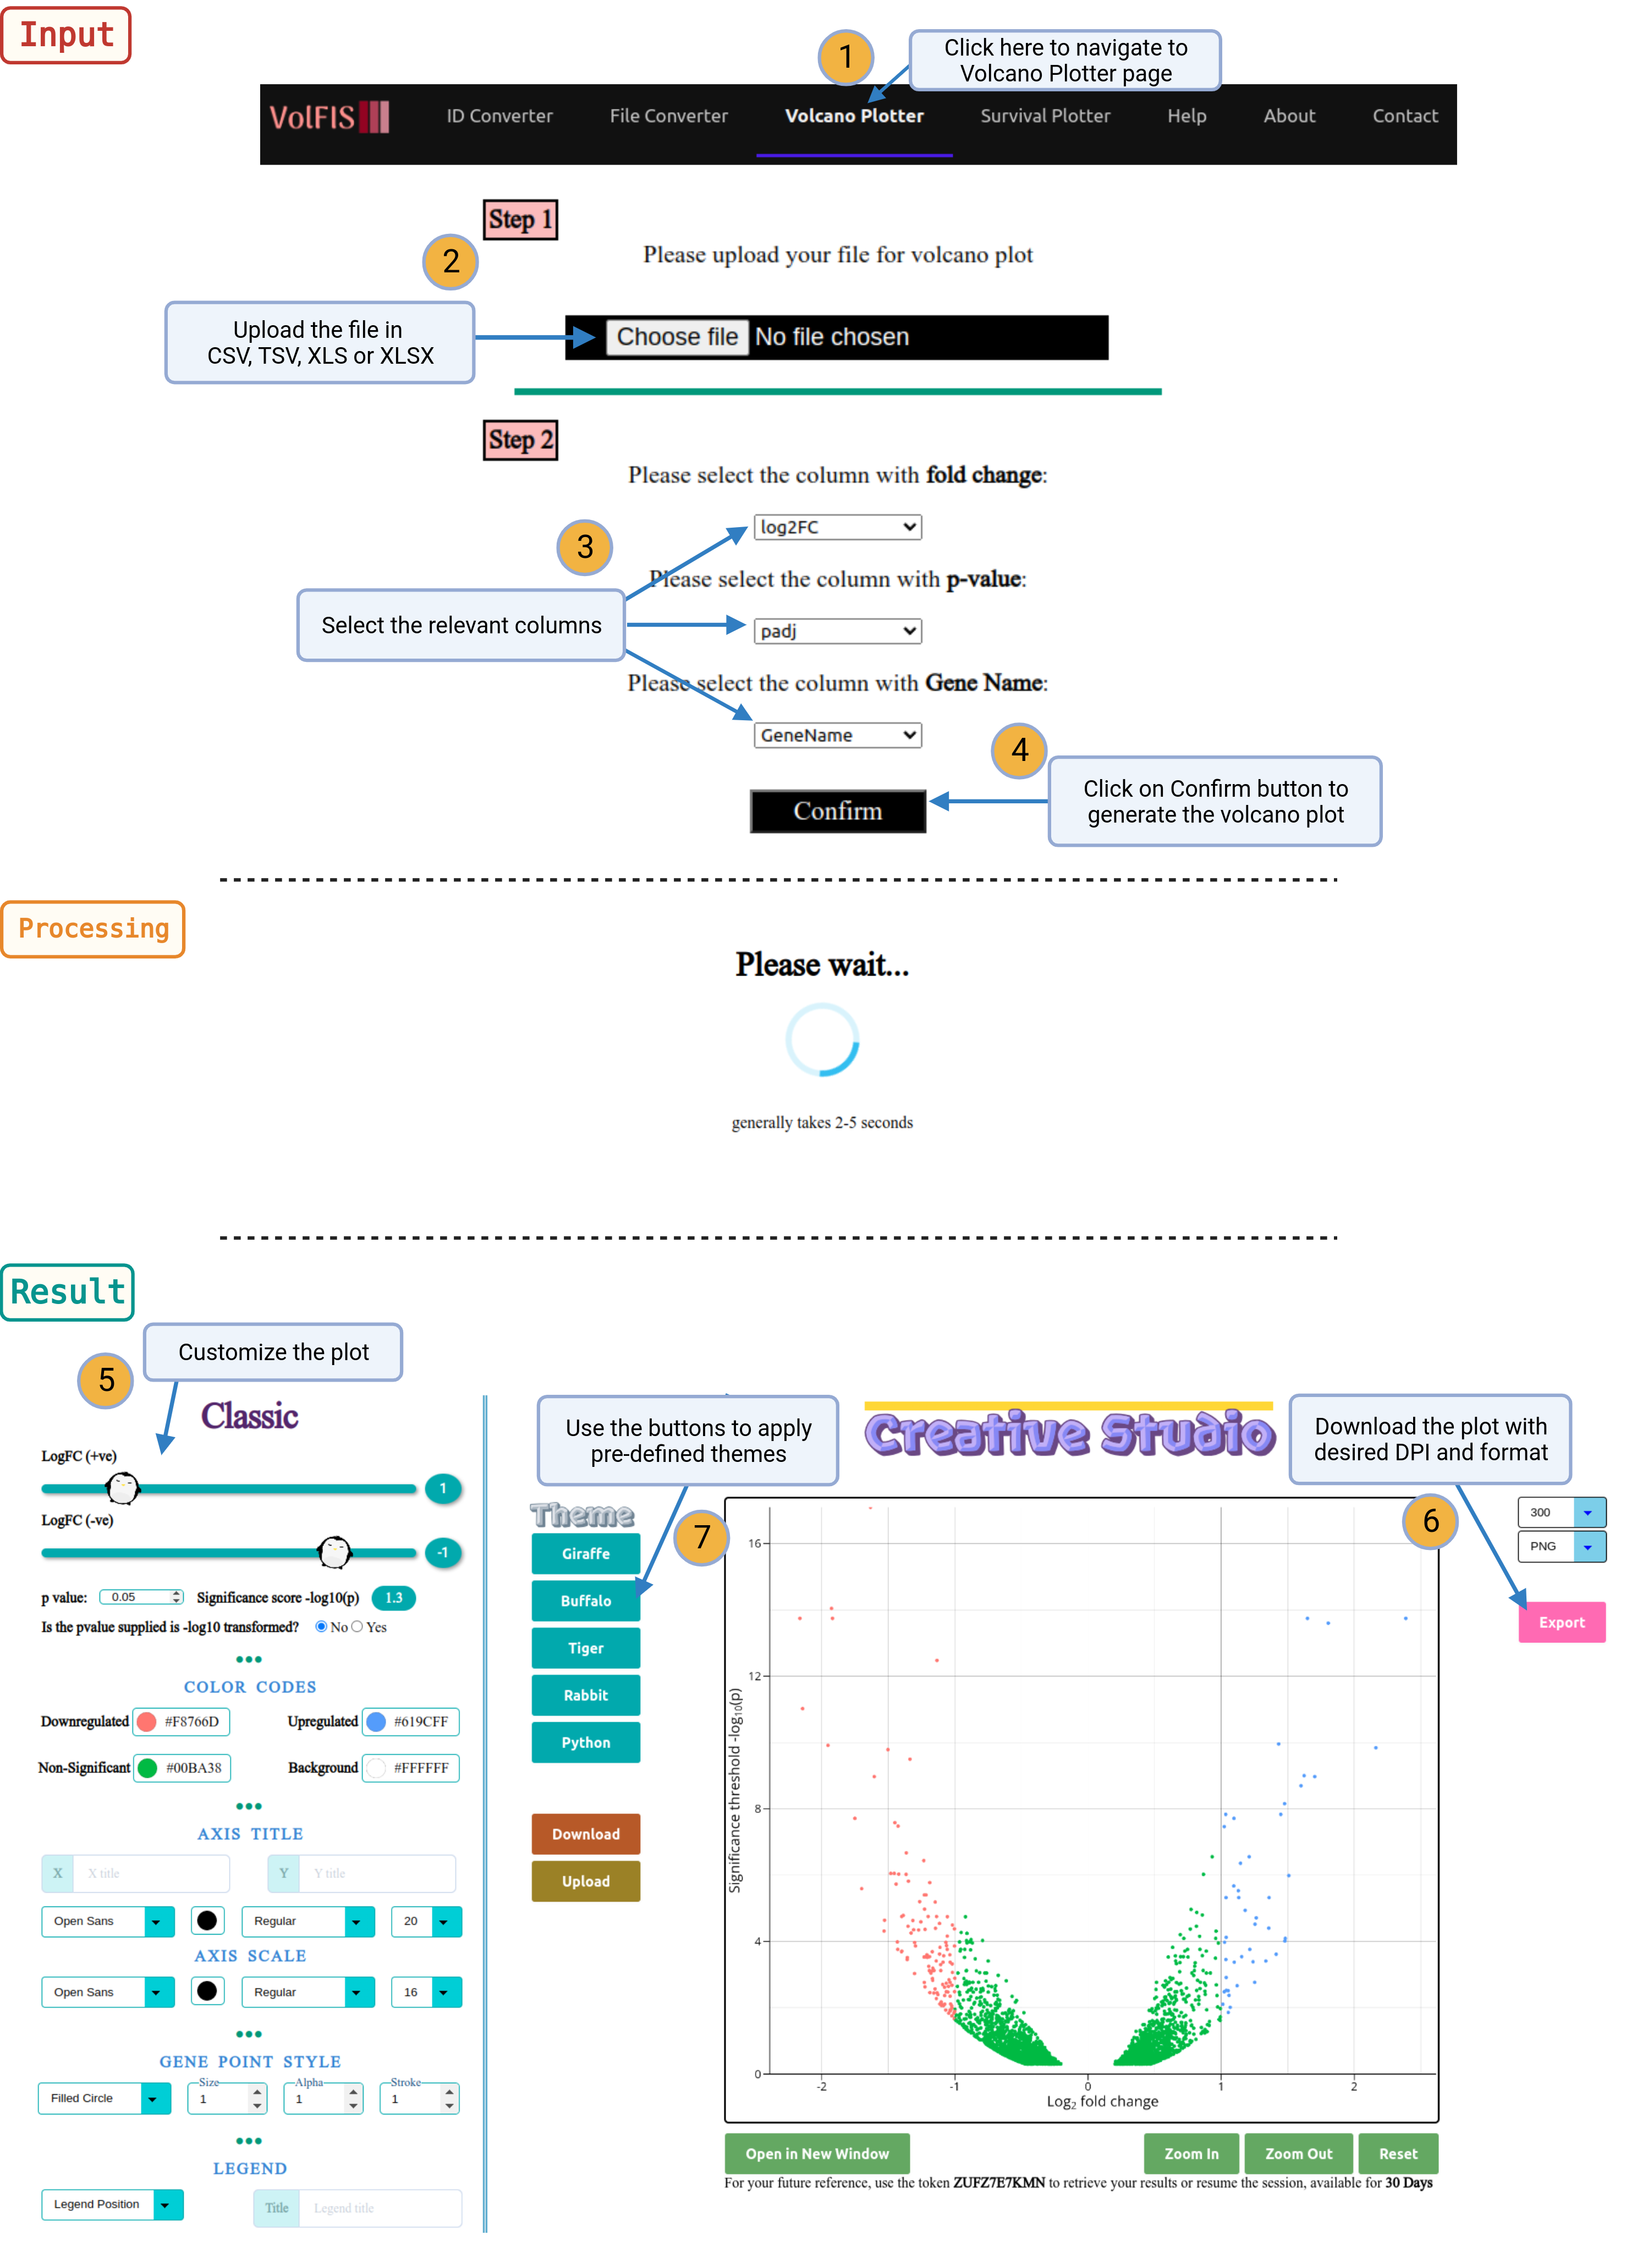
1. Navigate: Click on the Volcano Plotter option provided in the navigation bar on top of the page.
2. Upload File: Begin by uploading an input file with the three essential columns:
- Gene Name
- Log2 Fold Change (log2FC)
- p-value
Optionally, users may provide an additional column containing genes of interest or choose genes directly from a dynamically generated dropdown list that is populated using the input file.
3. Select Columns: After uploading the file, users will need to specify which columns correspond to the necessary data types. This is done by selecting the columns from the dropdown list, which is dynamically generated based on the content of the uploaded file. Choose the appropriate columns for:
- Gene Name
- Log2 Fold Change (log2FC)
- p-value
Once the selections are made, click the "Confirm" button.
4. Generate Volcano Plot: The Volcano Plotter will generate a volcano plot with default parameters. Users can review the initial plot and then proceed to customize it according to their preferences.
5. Customization Options: The user has the option to further customize the volcano plot. More customizable options are available in the section Advance. These options allow users to modify the appearance and styling of the plot to meet their specific requirements.
6. Retrieve Plots: Once the desired customization is applied, users can retrieve the generated plots in their preferred DPI (dots per inch) and format. This ensures that the plots meet the specific needs of the user.
7. Theme Options: Users can choose to apply available themes, upload custom themes, or export the current theme configuration for future use. This offers a high degree of flexibility in visual presentation.

Points to remember
- Allowed file types are :: CSV, TSV, XLS, XLSX
- Maximum file size is 5 MB
- Columns containing Gene Name, log2FC and P-Value are mandatory
- First Row should contain the Column Name
- Columns containing log2FC and P-Value should be numeric
- Mandatory Columns should not have empty values
- Avoid using special characters like (. , - , ',') in Row names
Survival Plotter
VolFIS introduces the Survival Plotter, an indispensable tool for generating exquisite, highly customizable, and publication-ready survival plots.
With this feature, users can effortlessly create visually appealing plots by simply providing an input file containing columns for time intervals, survival status (e.g., dead or alive), and a dependent variable such as sex or gender. A wide range of customization options is available to cater to the user's specific needs.
Examples
Instructions
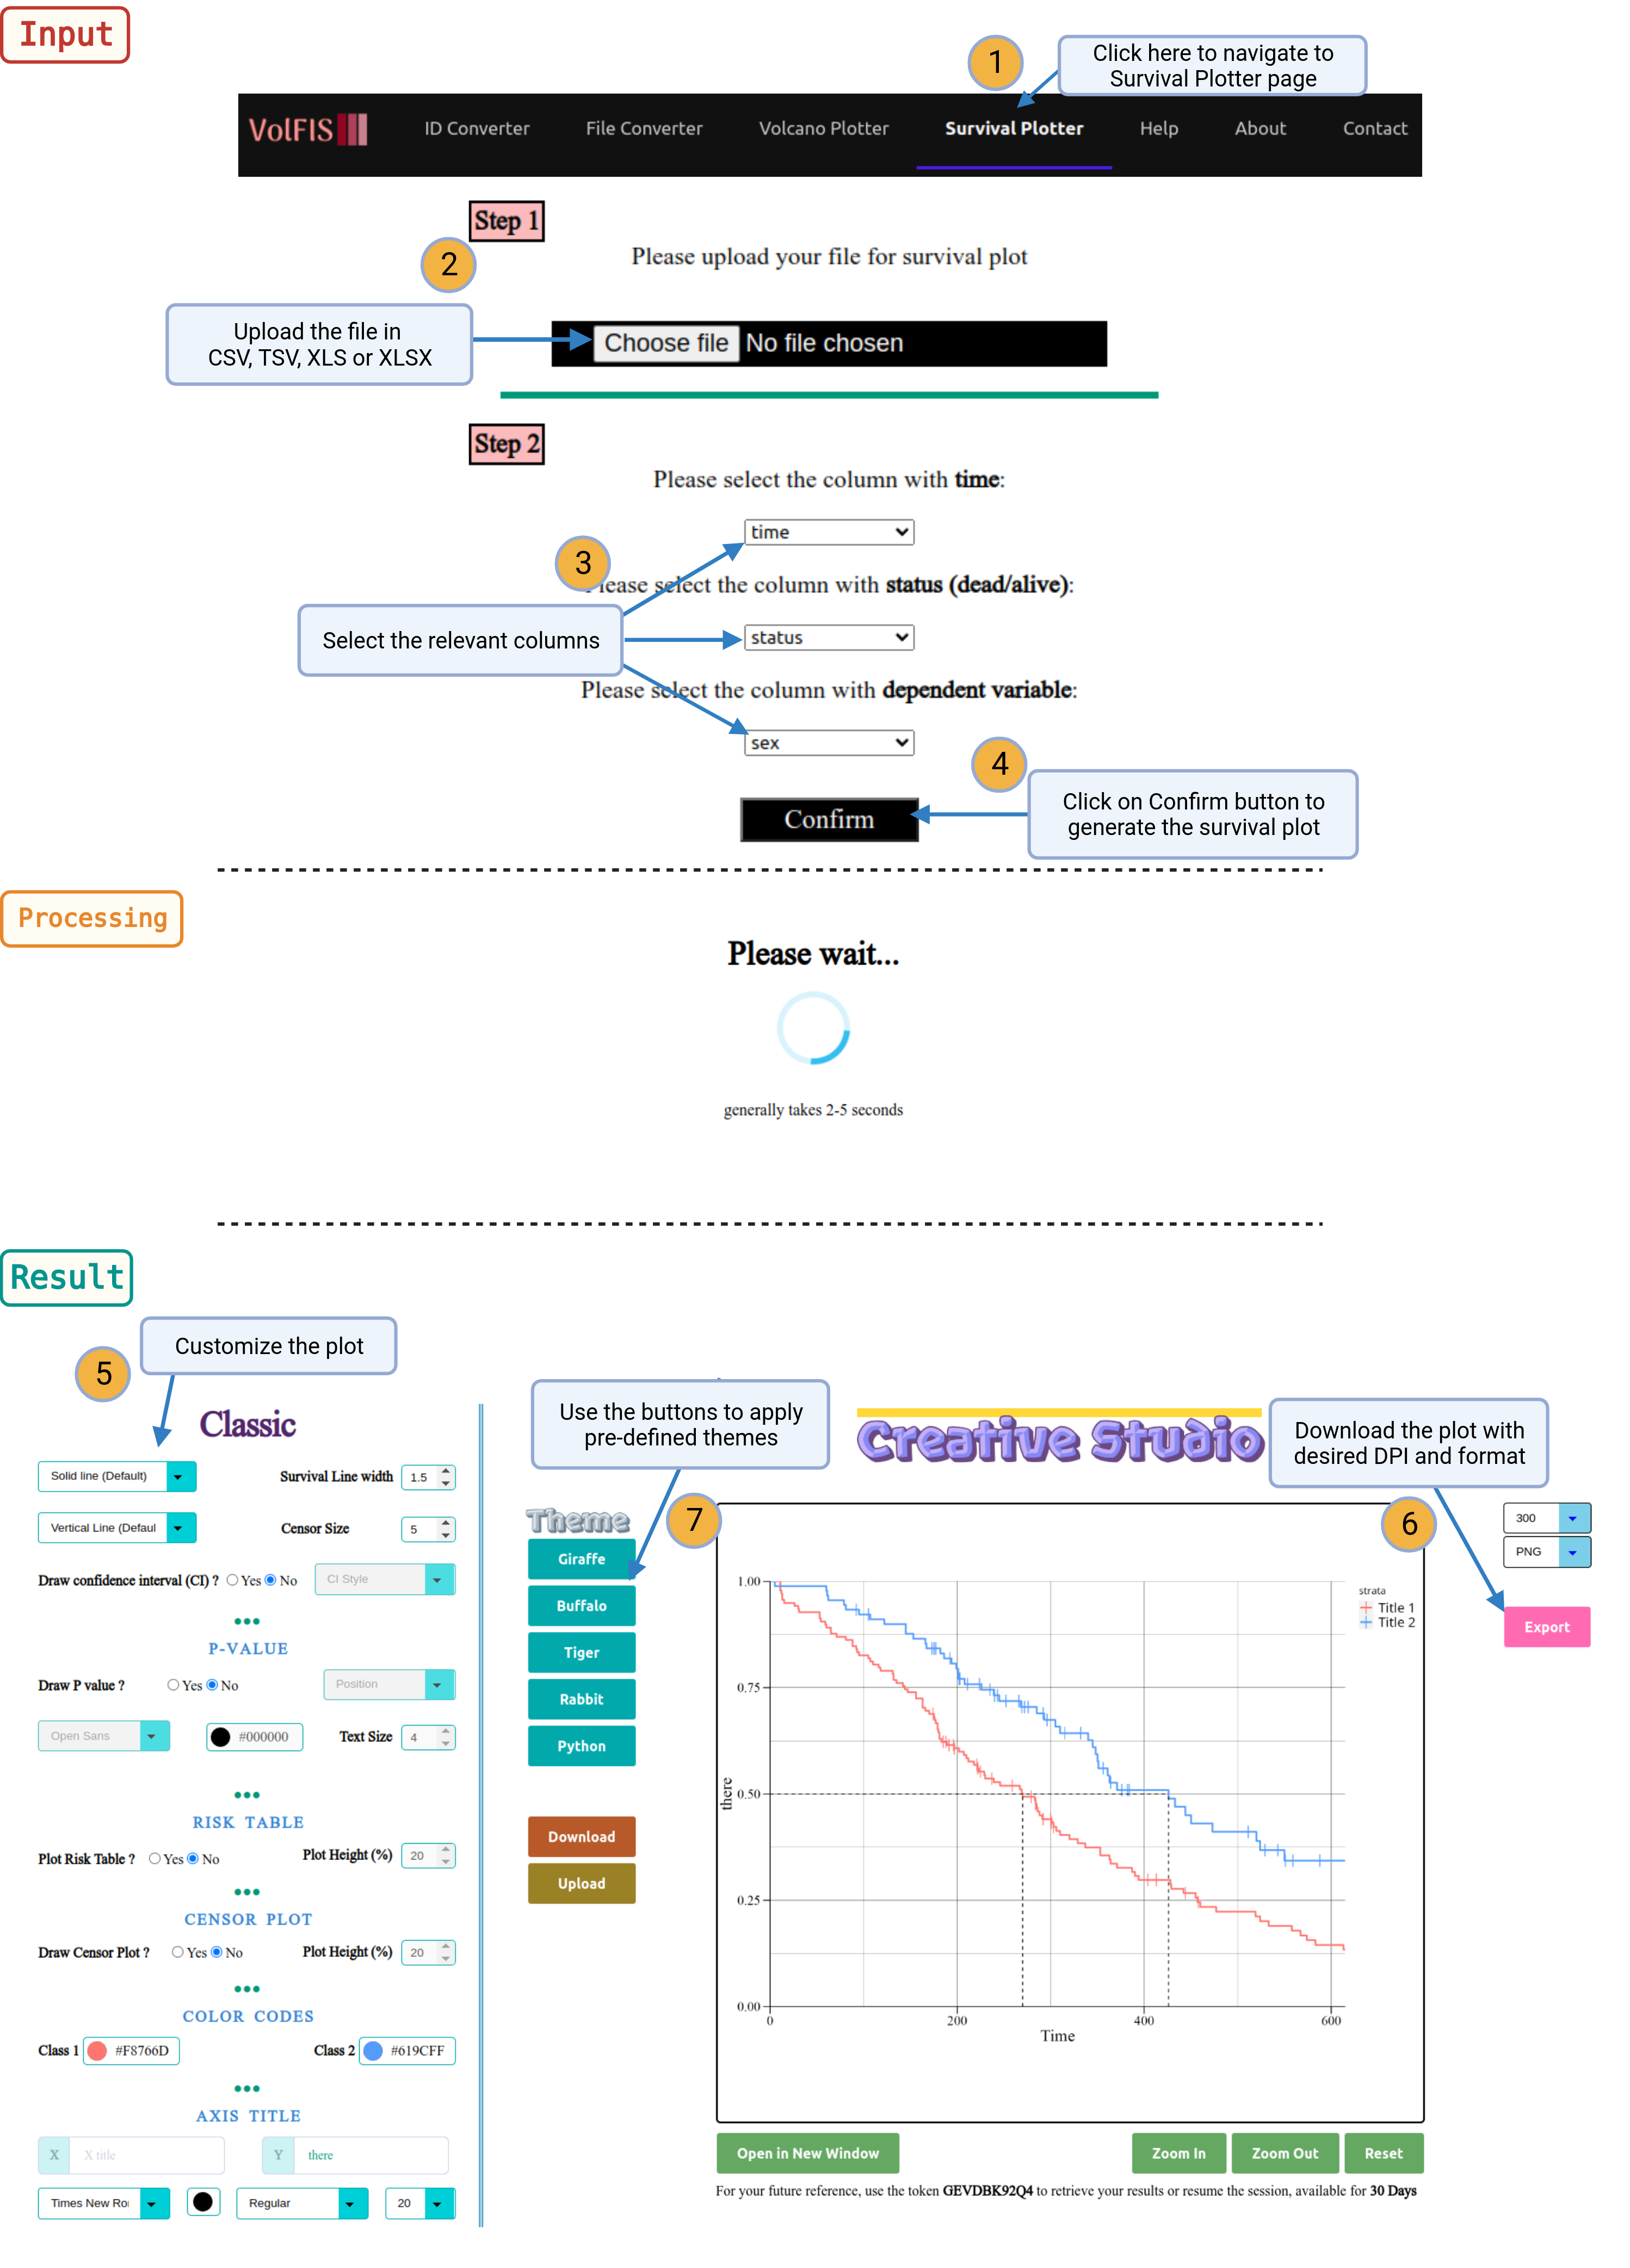
1. Navigate: Click on the Survival Plotter option provided in the navigation bar on top of the page.
2. Upload File: Begin by uploading an input file with the three essential columns:
- Time Interval
- Survival Status (e.g., Dead or Alive)
- Dependent Variable (e.g., Sex or Gender)
3. Select Columns: After uploading the file, users will need to specify which columns correspond to the necessary data types. This is done by selecting the columns from a dynamically generated dropdown list based on the content of the uploaded file. Choose the appropriate columns for:
- Time Interval
- Survival Status
- Dependent Variable
After making these selections, click the "Confirm" button.
4. Generate Volcano Plot: The Survival Plotter will generate a survival plot with default parameters. Users can review the initial plot and then proceed to customize it according to their preferences.
5. Customization Options: Users have the option to further customize the survival plot. More customization options are provided in the section Advance. These options allow users to modify the appearance, styling, and annotations of the plot to meet their specific requirements.
6. Retrieve Plots: Once the desired customization is applied, users can retrieve the generated survival plots in their preferred DPI (dots per inch) and format. This ensures that the plots are tailored to the user's specific needs.
7. Theme Options: Users can choose to apply available themes, upload custom themes, or export the current theme configuration for future use. This flexibility allows for consistent and visually appealing plot presentations.

Points to remember
- Allowed file types are :: CSV, TSV, XLS, XLSX
- Maximum file size is 5 MB
- Columns containing Time Interval, Survival Status and Dependent Variable are mandatory
- First Row should contain the Column Name
- Column containing Time Interval should be numeric
- Mandatory Columns should not have empty values
- Avoid using special characters like (. , - , ',') in Row names