Data source:
In the present study, a total of nine high-throughput screening (HTS) assays data were downloaded from National Centre for Advancing Translational Sciences (NCATS) website and used for the machine learning (ML)-based models training and evaluation (Table 1). Initially, nine tab-separated files were downloaded from the NCATS website. Of the nine files, each contained information such as “Sample ID”, “Sample Name”, “PubChem SID”, “Primary MOA”, “Assay Name”, “CAS ID”, “AC50 value”, “Efficacy”, “Maximum Response”, “Drug Name”, “SMILES”, etc. Of the given columns, two columns, namely “SMILES” and “MAX_RESPONSE”, were extracted from each tab-separated file for further processing and machine learning-based models training and validation. According to the description given on the NCATS data browser (https://opendata.ncats.nih.gov/covid19/databrowser), a molecule with a MAX_RESPONSE value approaching -100 cab be considered as highly active while the one with MAX_RESPONSE value approaching zero or towards positive values can be considered as least active or inactive.
Table 1. List of assays used in the present study with the data source.
|
Assay ID |
Assay name |
Target category |
Download link |
|
1 |
Spike-ACE2 protein-protein interaction (AlphaLISA) |
Viral entry |
https://opendata.ncats.nih.gov/covid19/assay?aid=1 |
|
2 |
Spike-ACE2 protein-protein interaction (TruHit Counterscreen) |
Counterscreen |
https://opendata.ncats.nih.gov/covid19/assay?aid=2 |
|
6 |
ACE2 enzymatic activity |
Viral entry |
https://opendata.ncats.nih.gov/covid19/assay?aid=6 |
|
8 |
TMPRSS2 enzymatic activity |
Viral entry |
https://opendata.ncats.nih.gov/covid19/assay?aid=8 |
|
9 |
3CL enzymatic activity |
Viral replication |
https://opendata.ncats.nih.gov/covid19/assay?aid=9 |
|
14 |
SARS-CoV-2 cytopathic effect (CPE) |
Live virus infectivity |
https://opendata.ncats.nih.gov/covid19/assay?aid=14 |
|
15 |
SARS-CoV-2 cytopathic effect (host tox counterscreen) |
Counterscreen |
https://opendata.ncats.nih.gov/covid19/assay?aid=15 |
|
20 |
HEK293 cell line toxicity |
Counterscreen |
https://opendata.ncats.nih.gov/covid19/assay?aid=20 |
|
21 |
Human fibroblast toxicity |
Counterscreen |
https://opendata.ncats.nih.gov/covid19/assay?aid=21 |
Brief description of HTS assays:
The nine HTS assays (Table 1) used to test compounds’ bio-activities by NCATS can be broadly categorized into four different types viz. assay used to determine the molecules that (i) prevent viral entry into host cells (ii) prevent viral replication into host cells (iii) reverse the cytopathic effect of host cells (caused by SARS-CoV-2 virion) and (iv) show toxic effects against normal human/host cells.
AlphaLISA assay (Table 1, Assay ID-1) contains the therapeutic molecules that can potentially disrupt the interaction between SARS-CoV-2 Spike protein and the human host ACE2 receptor. The interaction between SARS-CoV-2 Spike protein and host ACE2 receptor plays a vital role during the viral entry into the human host. Thus, this assay aims to identify the molecules with the potential to prevent SARS-CoV-2 entry into the human host. The second assay, i.e., TruHit counterscreen (Table 1, Assay ID-2), helps identify false-positive compounds that interfere with the AlphaLISA readout in a non-specific manner.
ACE2 enzymatic activity assay (Table 1, Assay ID-6) measures the ACE2 inhibitory potential of compounds to prevent the disruption of endogenous enzyme function. The TMPRSS2 enzymatic activity assay (Table 1, Assay ID-8) is specific to measure the TMPRSS2 inhibitory potential of compounds. Recent studies have highlighted the importance of human TMPRSS2 as an antiviral drug target and made attempts to screen the molecules with inhibitory potential against TMPRSS2.
The 3CL enzymatic activity (Table 1, Assay ID-9) measures the inhibitory potential of molecules against viral 3-chymotrypsin like protease (3CLpro), the main protease of SARS-CoV-2. The enzyme is pivotal for the viral replication within human host cells. Thus, it is an important anti-SARS-CoV-2 drug target in COVID-19 drug discovery.
CPE assay (Table 1, Assay ID-14) determines the ability of a compound to reverse the cytopathic effect caused by SARS-CoV-2 in Vero E6 host cells. This assay can be used for the high-throughput screening of compounds with antiviral activity. In contrast, there are chances that a compound itself may show cytotoxicity; therefore, a counterscreen (Table 1, Assay ID-15) to measure the toxicity of compounds against host (Vero E6) cells is used for the detection of such compounds.
The general toxicity of compounds against HEK293 and Hh-Wt cell lines is measured with the help of HEK293 cell line toxicity (Table 1, Assay ID-20) and Human fibroblast toxicity assay (Table 1, Assay ID-21), respectively. More details about the assays used in the present study can be retrieved from the NCATS website (Table 1).
Descriptors and fingerprints (FPs) calculation:
The SMILES structures of the molecules are used for the calculation of a total of 1444 1D, 2D descriptors and 12 different types of fingerprints (FPs) calculation using open-source software PaDEL (v2.21).
Data pre-processing:
The pre-processing of data is an important task for any machine learning study. Therefore, a systematic approach is applied to process the molecular structure data while molecular descriptors and fingerprints calculation (Figure 3). The parameters opted on PaDEL software (before actually starting the descriptors / FPs calculation) are “Remove salt”, “Detect aromaticity”, “Standardize nitro groups”, “Max. threads -1”, “Max. waiting jobs -1”, “Max. Running time per molecule: 12,00,000 milliseconds”, and “Retain molecules order”. Furthermore, only those molecules for which all the descriptor/fingerprint values are calculated have been used for ML-based models training, validation and further analysis.
Figure 3: A systematic computational approach used for building ML-based QSAR prediction models and their usage by users. (A). Flow diagram depicting the overall strategy used to train, evaluate and build the ML-based QSAR prediction models. (B). The best prediction models can be used by users to predict the anti-SARS-CoV-2 activity and human cell toxicity of compounds. |
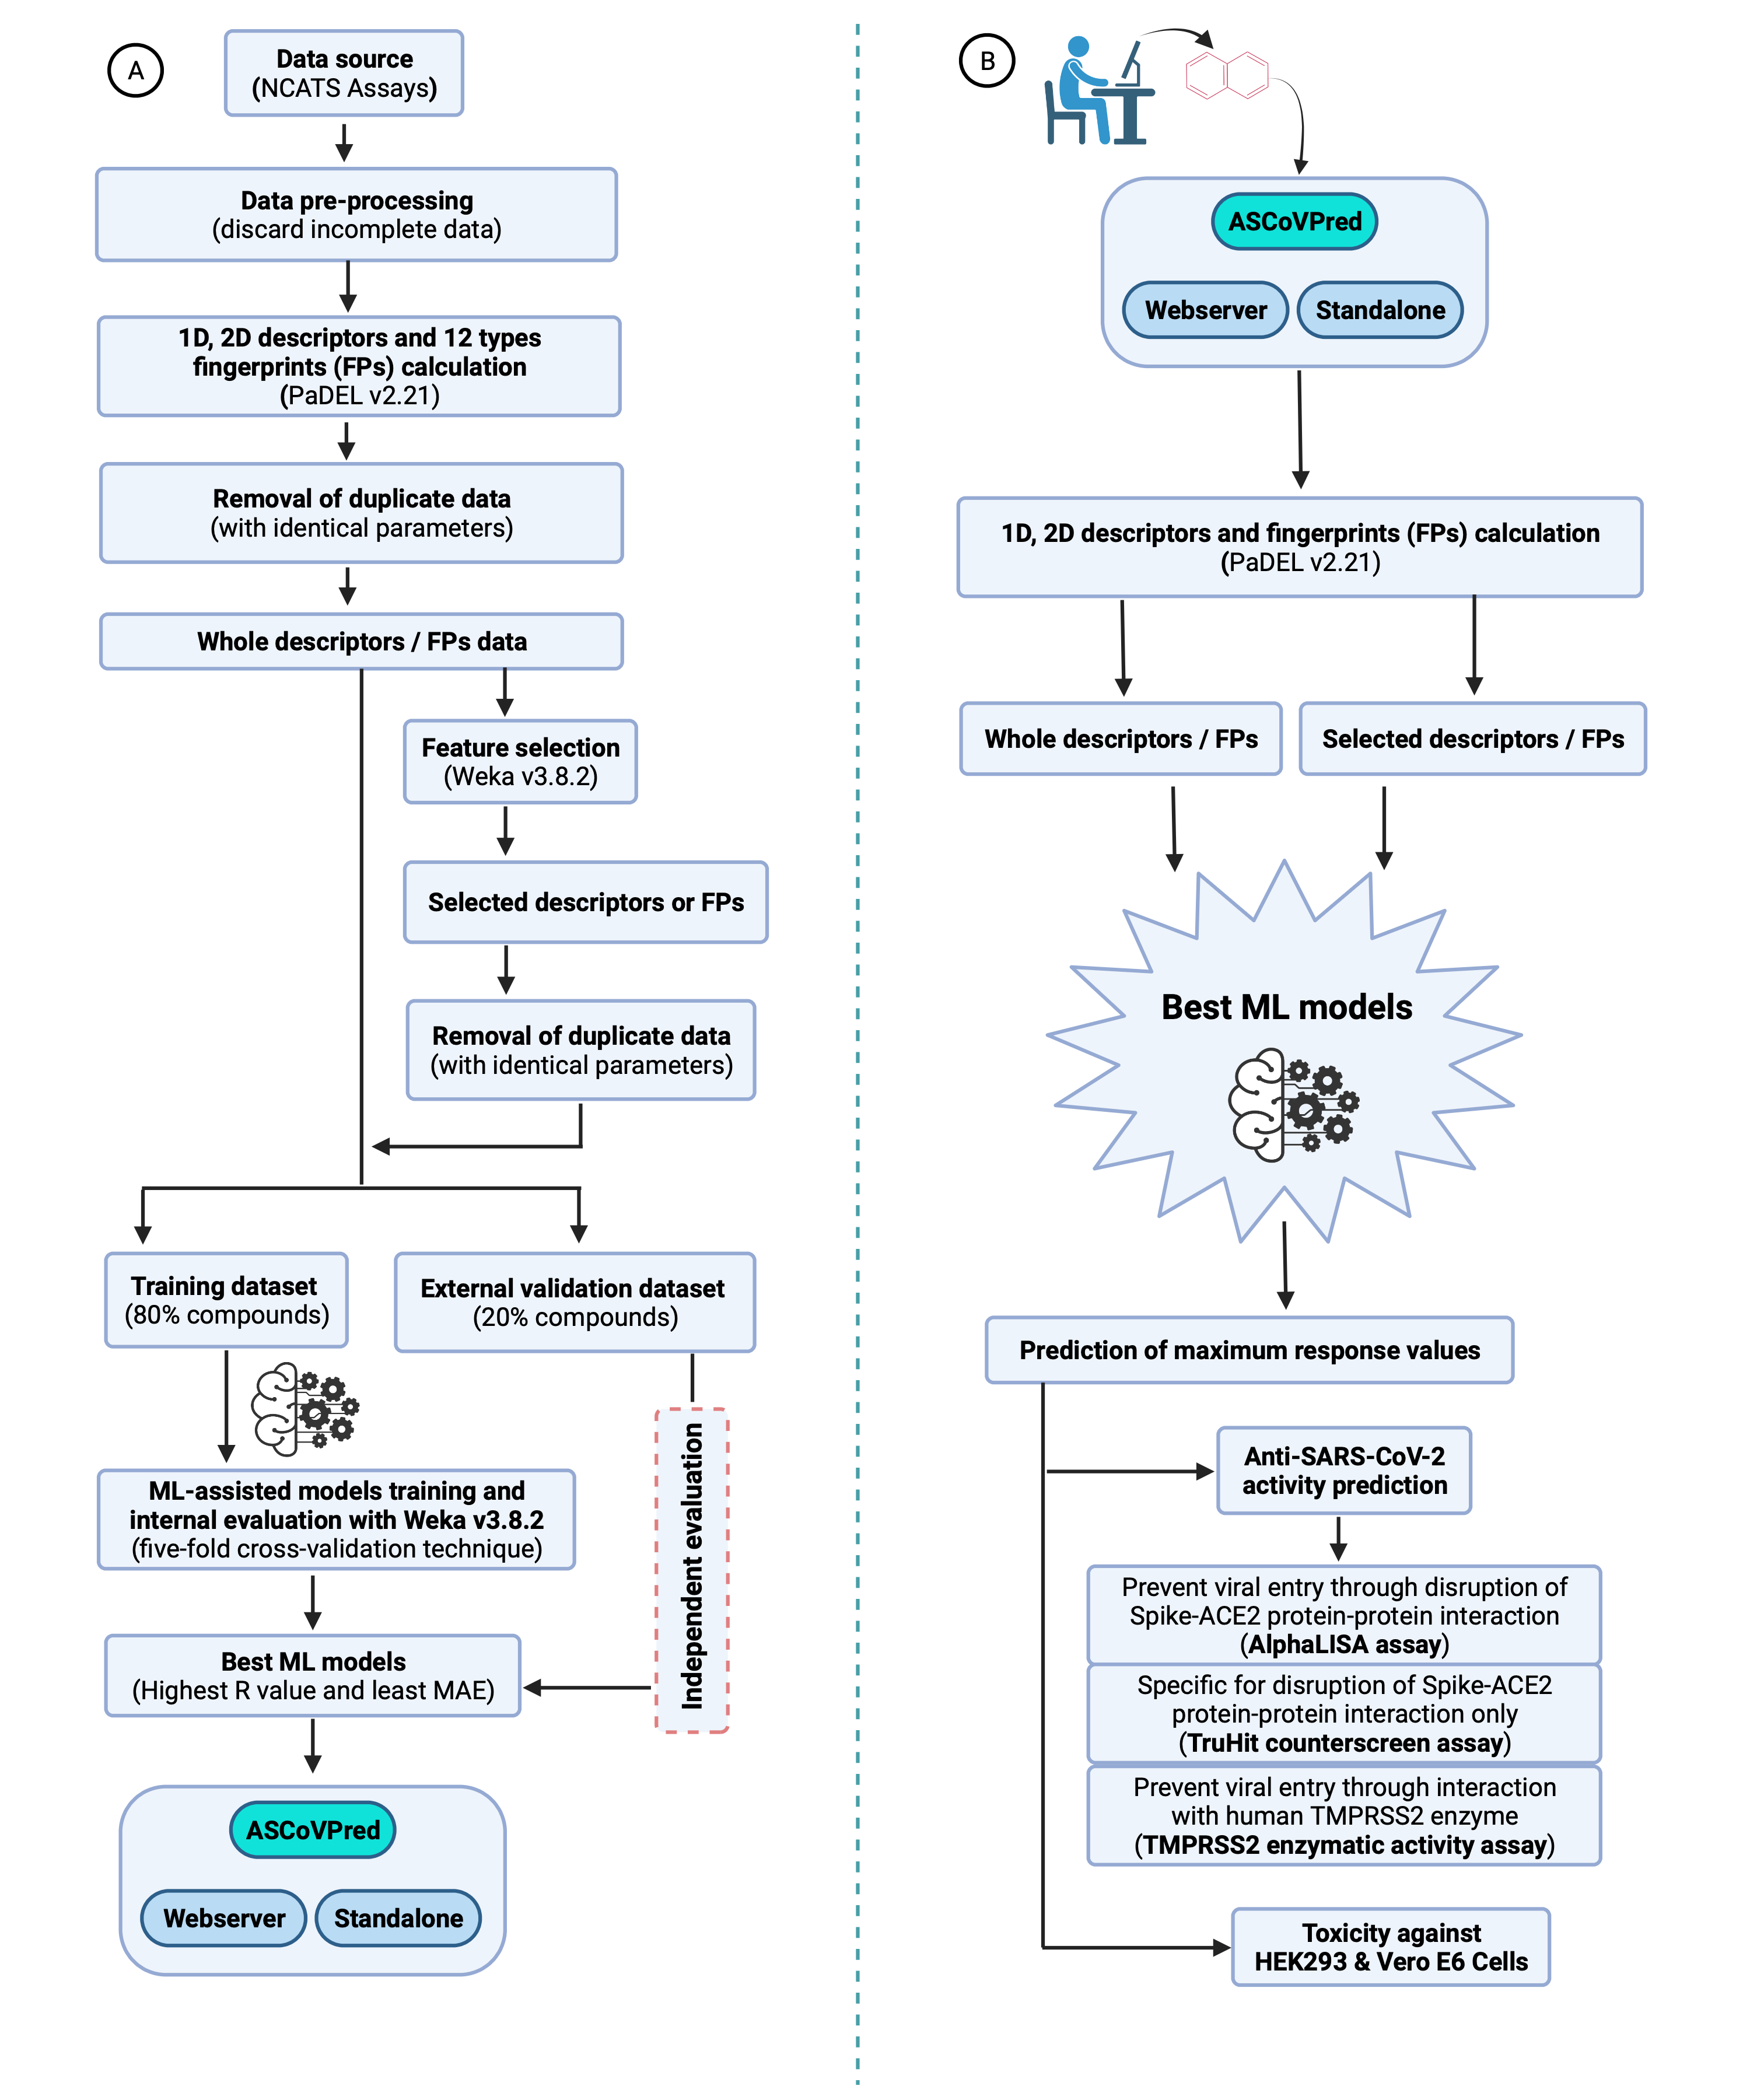 |
Preparation of datasets for models training and validation:
Data pre-processing and filtering are followed by redundancy removal to retrieve the dataset of unique molecules. Therefore, the molecules possessing identical descriptor or FPs values and maximum response values are included only once. The unique dataset of molecules was further split into a training dataset (80% molecules) and a external validation dataset (20% molecules). The training datasets are used for training and internal validation (through five-fold cross-validation technique) of the ML-based models, while external validation datasets are kept separate for the final or external validation of the developed models. The number of compounds used for the trainning (through five-fold cross-validation technique) and evaluation of best ML-based QSAR models are given in Table 2.
Table 2. The number of molecules used for the training and evaluation of best prediction models.
|
Assay ID |
Number of unique molecules |
Number of training dataset molecules |
Number of external validation dataset molecules |
|
1 |
3370 |
2696 |
674 |
|
2 |
3235 |
2588 |
647 |
|
6 |
3376 |
2701 |
675 |
|
8 |
5144 |
4115 |
1029 |
|
9 |
11007 |
8806 |
2201 |
|
14 |
9909 |
7927 |
1982 |
|
15 |
9080 |
7264 |
1816 |
|
20 |
9694 |
7755 |
1939 |
|
21 |
4491 |
3593 |
898 |
Descriptors or feature selection:
In the past, it has been observed that all the features or descriptors are not equally important to predict the biological activity of the molecules. Therefore, a feature selection technique in WEKA v3.8.2 is applied to determine the most relevant descriptors and fingerprints associated with the biological activity of the molecules. Thus, “CfsSubsetEval” (with default parameter values) as “Attribute Evaluator” with “BestFirst” as “Search Method” (with default parameter values) is used as feature selection techniques for the present study. This technique has been extensively used for features selection in various chemical QSAR and classification-related studies.
Tools used for model building:
An open-source data mining and ML tool, WEKA (v3.8.2), has been used in the present study to train and validate the prediction models.
Cross-validation technique used:
The prioritization of best models (with the highest efficacy) is important in any ML-based study. In the present study, thousands of models (the results for best models from each assay are given in Table 3) were trained with all regression techniques available in WEKA, however, selection of the best models is made through the five-fold cross-validation technique. This technique has been widely used in previous studies to prioritize the best prediction/classification models. In the five-fold cross-validation technique, the whole training dataset is divided into five almost equal-sized parts and each part is used in the training and testing of the prediction models.
Formulae used to evaluate the models' performance:
The in-built functions available with WEKA (v3.8.2), such as Pearson Correlation Coefficient (R), mean absolute error (MAE) and root mean squared error (RMSE), have been used to evaluate the models' performance through five-fold cross-validation technique. In both internal and external validation, the models with the highest R-value and lowest MAE and RMSE values are selected as the best prediction models. The latter are hosted on the ASCovPred webserver for public use. The equations for the used formulae are as given below:
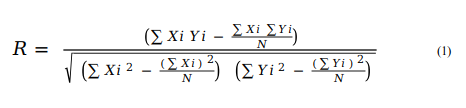
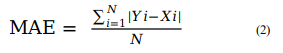
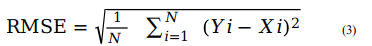
For ith compound, Yi and Xi represent predicted and actual maximum response value, respectively. N is total number of compounds. The value of R is used to measure the quality of model. The value of R varies from −1 to +1. The negative value of R shows the negative correlation with a particular property or feature. Thus, higher the value of R, better will be the quality of model in terms of the predicted maximum response value of the compounds.
Table 3. Performance of best ML-based QSAR models on training and external validation dataset of compounds.
|
Performance evaluation of best models with training dataset compounds (five-fold cross-validation) |
Performance evaluation of best models with external validation dataset compounds |
|||||||||||
|
Assay ID |
Deployed on ASCoVPred |
Descriptors or fingerprints type |
Number of input features |
R |
R2 |
MAE |
RMSE |
WEKA technique used for training the model with training dataset of compounds |
R |
R2 |
MAE |
RMSE |
|
Yes |
SubFPC* |
307 |
0.67 |
0.44 |
14.96 |
21.22 |
weka.classifiers.meta.AdditiveRegression (RandomForest) |
0.66 |
0.42 |
17.41 |
24.95 |
|
|
Yes |
1D & 2D |
50 |
0.72 |
0.51 |
13.51 |
18.83 |
weka.classifiers.meta.AdditiveRegression (RandomForest) |
0.74 |
0.55 |
14.44 |
20.50 |
|
|
No |
ExtendedFingerprinter |
28 |
0.32 |
0.10 |
14.31 |
37.09 |
weka.classifiers.trees.RandomForest |
0.57 |
0.32 |
16.68 |
44.88 |
|
|
Yes |
SubFPC* |
307 |
0.52 |
0.24 |
11.12 |
36.47 |
weka.classifiers.trees.RandomForest |
0.73 |
0.36 |
14.99 |
44.64 |
|
|
No |
SubFPC* |
307 |
0.40 |
0.16 |
5.90 |
11.31 |
weka.classifiers.meta.RandomCommittee (RandomForest) |
0.45 |
0.19 |
5.11 |
9.14 |
|
|
14 |
No |
1D & 2D |
1444 |
0.50 |
0.25 |
7.43 |
14.59 |
weka.classifiers.meta.RandomSubSpace (RandomForest) |
0.43 |
0.18 |
8.23 |
14.90 |
|
15 |
Yes |
1D & 2D |
1444 |
0.66 |
0.43 |
13.12 |
21.13 |
weka.classifiers.meta.AdditiveRegression (RandomForest) |
0.65 |
0.42 |
14.11 |
21.93 |
|
20 |
Yes |
SubFPC* |
307 |
0.66 |
0.44 |
26.68 |
34.16 |
weka.classifiers.meta.RandomCommittee (RandomForest) |
0.68 |
0.46 |
26.41 |
33.87 |
|
21 |
No |
1D & 2D |
45 |
0.43 |
0.18 |
12.61 |
19.69 |
weka.classifiers.meta.RandomCommittee (RandomForest) |
0.51 |
0.26 |
11.99 |
18.63 |
*SubstructureFingerprintCount
Identification of descriptors of FPs associated with the maximum response:
To understand the relative contribution of different descriptors and fingerprints (FPs) in determining the molecules’ maximum response values, assay-wise, R values were calculated between these. The molecules with top 10 positively and negatively correlated descriptors or FPs values (Supplementary_files 10-19, Table 1) were shortlisted from the training dataset molecules along with their maximum response values and sorted in the ascending order of maximum response values. Further, top 100 records (highly active compounds) (Supplementary_files 10-19, Table 2) and bottom 100 records (least active compounds) (Supplementary_files 10-19, Table 3) were selected for both positively and negatively correlated descriptors and FPs. Finally, the average values were calculated for each descriptor and FP (Supplementary_files 10-19, Table 4). Grouped bar charts were plotted to compare the average values of descriptors / FPs amongst highly active and least active compounds (Supplementary_files 10-19, Figure 1). Thus, the grouped bar charts depict the differences of descriptors / FPs average values amongst highly active and least active compounds.
Note: Please refer to Table 4 (given below) to see all the Supplementary files.
Table 4. Supplementary excel files containing results for performance of all ML-based QSAR models and data analysis results.
|
Assay ID |
Deployed on ASCoVPred web server and standalone |
Assay Name |
Target Category |
ML-based prediction results |
Data analysis results |
|
1 |
Yes |
Spike-ACE2 protein-protein interaction (AlphaLISA) |
Viral Entry |
||
|
2 |
Yes |
Spike-ACE2 protein-protein interaction (TruHit Counterscreen) |
Counterscreen |
||
|
6 |
No |
ACE2 enzymatic activity |
Viral Entry |
N/A |
|
|
8 |
Yes |
TMPRSS2 enzymatic activity |
Viral Entry |
||
|
9 |
No |
3CL enzymatic activity |
Viral replication |
N/A |
|
|
14 |
No |
SARS-CoV-2 cytopathic effect (CPE) |
Live virus infectivity |
N/A |
|
|
15 |
Yes |
SARS-CoV-2 cytopathic effect (host tox counterscreen) |
Counterscreen |
||
|
20 |
Yes |
HEK293 cell line toxicity |
Counterscreen |
||
|
21 |
No |
Human fibroblast toxicity |
Counterscreen |
N/A |